I found an FAQ for that
In which we talk about ice, the polar vortex, and thank some trees.

Snow water equivalent
Some cool visuals looking at the snow water equivalent (SWE) in the Sierras. Sort of a different perspective on all that precipitation.
@INSTAAR just released the 2/1/23 real time SWE report. Percent of 2001-2021 avg ranges BTW 174-250+%. Check it out! We have updated our model and have added comparisons to @airbornesnow #CAwater #CAwx #CAclimate @CA_DWR #westernwater #water #rainonsnow #climatechange #climate
— Leanne Lestak (@lestak) 12:46 AM ∙ Feb 10, 2023
Updated Global Surface Temperature Dataset
That dataset is used to make images like this, which you’ve probably seen before.
Weather Feed is a reader-supported publication. To receive new posts and support my work, consider becoming a free or paid subscriber.
⚠️ NCEI will switch to an updated version of the NOAAGlobalTemp dataset that has full global coverage with the release of the January 2023 Global Climate report on February 14, 2023. bit.ly/NOAAGlobalTemp #GlobalClimate #Climate #Data
— NOAA NCEI (@NOAANCEI) 4:03 PM ∙ Feb 10, 2023
The full article (NOAA Updates its Global Surface Temperature Dataset) goes into more detail, but basically the data covers more of the globe now. It also starts from January 1850, which is an additional 30 years.
Interactive hurricane mapping tool… thing
It’s an interactive GIS map that NOAA built. I’ve just started working with GIS. I can’t do anything cool with it but it’s a lot of fun to play around with.
Explore locations & severity of #hurricanes and tropical cyclones since 1842 with this interactive mapping tool. climate.gov/maps-data/data…
— NOAA Climate.gov (@NOAAClimate) 4:00 PM ∙ Feb 10, 2023
Here’s a link to an article about the tool, and here’s a link to the tool itself.
It breaketh away
If I used the calculator correctly, that’s about 598.46 square miles. So kinda big.
🔵 Calving and movement of #Iceberg A-81 #Antarctica🇦🇶 22 Jan to 9 Feb 2023 #Copernicus🇪🇺 #Sentinel-3🛰️ Full-size ➡️ flic.kr/p/2ogdEzu The Iceberg is about 52 by 46 kilometers in size with a total area of about 1,550 square kilometers @CopernicusEU @sentinel_hub
— Pierre Markuse (@Pierre_Markuse) 1:27 PM ∙ Feb 10, 2023
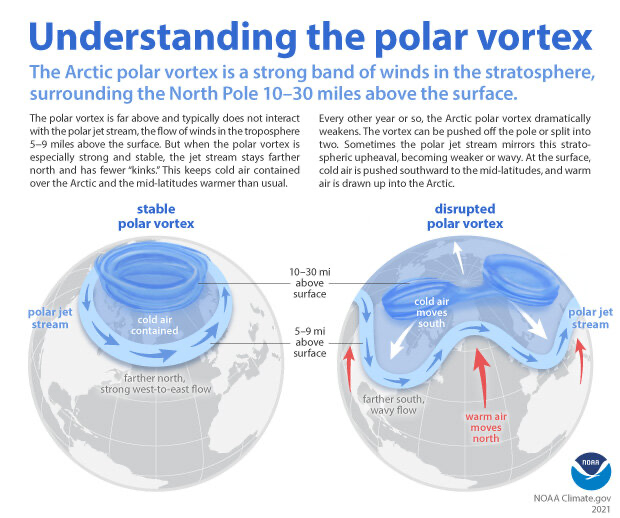
Potential polar vortex changes
This is a quick rundown on the polar vortex and some potential changes to it. Could be something to keep an eye on over the next few weeks.
The polar vortex is about to do something really weird — warming as much as 60 degrees!
— MyRadar Weather (@MyRadarWX) 2:51 PM ∙ Feb 11, 2023
That could jumble weather patterns across the Northern Hemisphere. @MatthewCappucci explains:
Thanks trees
Just one of the many variables that contribute to local weather. Trees absorb and store solar energy, but they can also radiate heat energy!
Yesterday, some of the warmest regional temps were over NE MN, NW WI, and the U.P. Why? Trees! These areas reached into the 40s and 50s yesterday, while other spots in western and southern Minnesota and central Wisconsin only got into the mid to high 30s. #mnwx #wiwx
— NWS Duluth (@NWSduluth) 7:06 AM ∙ Feb 12, 2023
Stay with me on this one
So we start with a (particular) volcanic eruption.
Large stratospheric H20 vapor injection by Hunga Tonga–Hunga Ha’apai eruption "will probably increase net radiative forcing, unusual for large volcanic eruption, increas[es] chance of global sfc temp anom temporarily exceeding 1.5 °C over coming decade."
— Daniel Swain (@Weather_West) 5:32 PM ∙ Feb 11, 2023
You’ll probably need to read more about this, but if I’m following this correctly:
- Volcanic eruptions can sometimes impact the climate by creating a short term cooling effect (reference 1, reference 2).
- For the eruption covered in the article, it sounds like it’s going to cause a short term warming effect instead, due to the amount of water vapor sent into the atmosphere.
Great Lakes ice cover ⬇️
I knew it had been a fairly mild winter but I didn’t think about the impact on ice cover.
Ice cover on the #GreatLakes has dipped to a record low for this time of year, based on 51 years of Great Lakes ice data. As of Feb 12, the lakes currently have just 7.5% ice cover -- slightly below the previous low of 8.5% set in 2012, and well below the historic average of 41%.
— Great Lakes Ice Tracker (@glicetracker) 11:55 AM ∙ Feb 13, 2023
Gabrielle is still spinning
More atmospheric moisture, heavy rains and flooding for #NewZealand as #Gabrielle moves across the North Island toward the South Island. States of emergency are in place for #Auckland and most of the North Island. TPW updates at tropic.ssec.wisc.edu/real-time/mtpw… #AucklandWeather
— UW-Madison CIMSS (@UWCIMSS) 5:41 PM ∙ Feb 13, 2023
🛰 Aotearoa from above 🌀
— MetService (@MetService) 7:48 PM ∙ Feb 13, 2023
#CycloneGabrielle is currently centred just east of Great Barrier Island. But the sweep of her cloud is well past Christchurch.
Yet another resource for climate change FAQs
Stumbled on this global warming FAQ. It’s another concise list of Q&As related to climate change.
Until next time — Yeah BUOY!
Will you be my Valentine?
— NOAA Research (@NOAAResearch) 9:47 PM ∙ Feb 10, 2023
Yeah Buoy✅
NOAA thank you❌
Thanks for tuning in for our Valentine's Day puns today, have a happy weekend!
Weather Feed is a reader-supported publication. To receive new posts and support my work, consider becoming a free or paid subscriber.