We've been busy
In which we have a few laughs and learn some stuff.
Maybe not the most exciting update but I’m on Bluesky now. I’ll likely stay away from Threads and just see how Bluesky develops 🤷♂️
It’s hard to pick just one
I know there’s a flood of info on the heat, so I’m just gonna quote one article and list a few links. This Washington Post article talks about recent events and some stuff that’s coming up this week. The article also explains wet bulb globe temperature, which I thought was worth sharing,
The heat index most people are familiar with only factors in temperature and humidity and assumes you are in the shade. For those who work or exercise outside, the “wet bulb globe temperature” (WBGT) can be a more useful measure of how the heat affects your body.
Through early next week, WBGT levels are forecast to hover in the upper 80s in many parts of the southern states. At these levels, the American College of Sports Medicine advises canceling or at least limiting high-intensity activities.
The WBGT is measured and predicted assuming direct sunlight. It also takes into account wind speed, sun angle and cloud cover. Like the heat index, the WBGT is forecast to remain extremely high across much of the southern United States into next week.
If you want to read more:
- As seas get hotter, South Florida gets slammed by an ocean heat wave (NPR)
- Some good info on preventing heat related illnesses and early warning signs
- Heatwaves show importance of health early warnings and action plans (WMO)
- Record temps as extreme heat hits worldwide in 2023 (EarthSky)
- A look at next week (Blog Weather US)
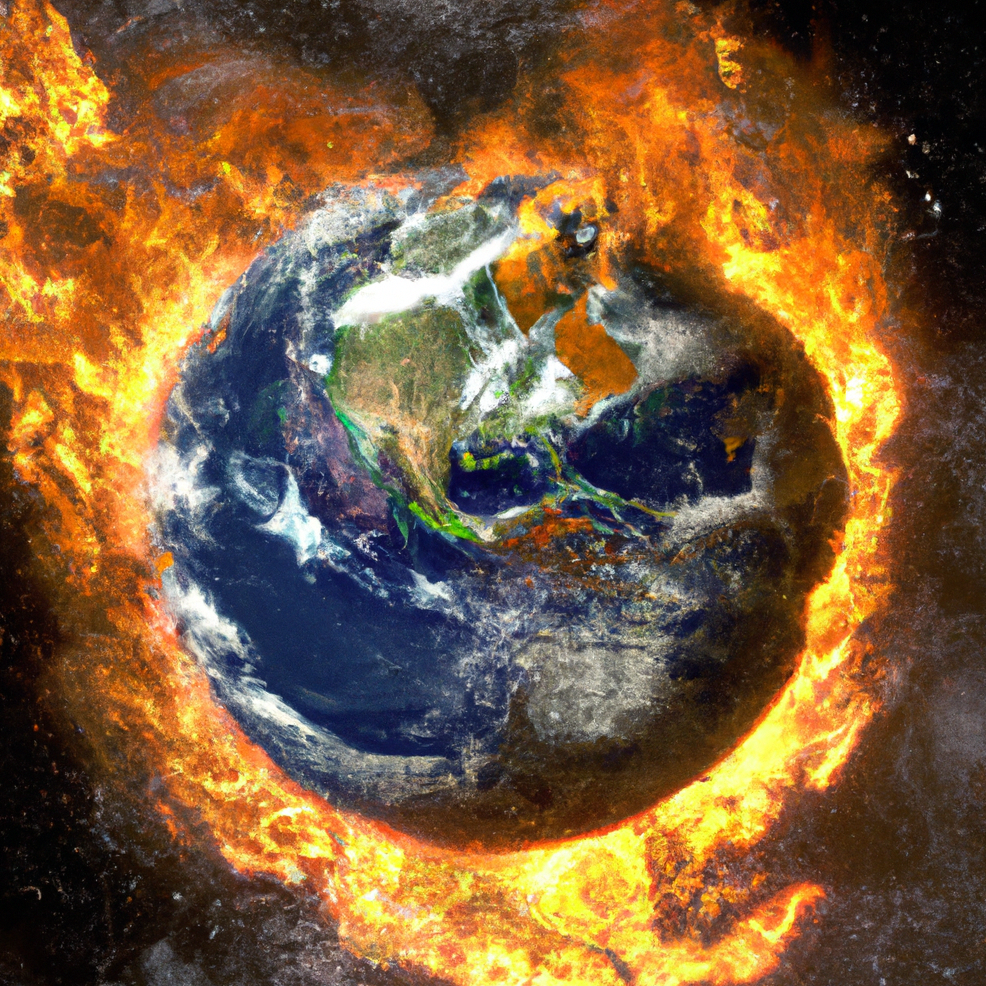
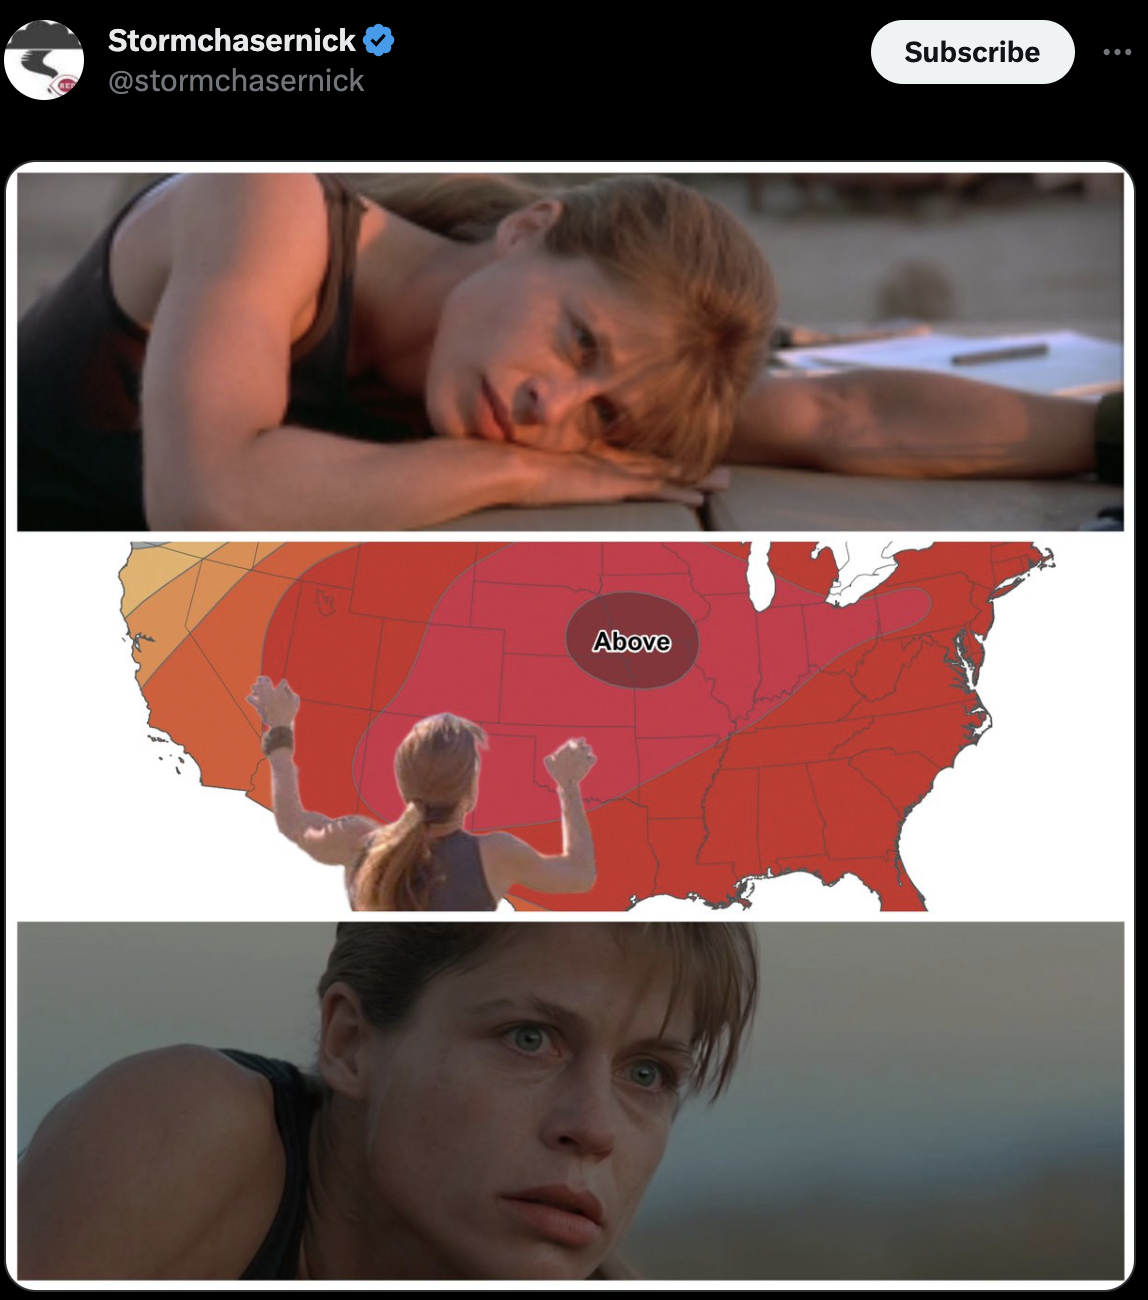
And finally, this meme.
The Weather Feed is a reader-supported publication. To receive new posts and support my work, consider becoming a free or paid subscriber.
A look forward, and a look back
Tornado Titans posted a new video recently that talks about this past spring and the rest of the summer. They do a great job of combining storm chasing footage with explanatory content.
Thank you
I’ve searched for weather-related Substacks but I somehow missed . I was very happy to see this short post from them that covers something I see pretty regularly online. People bring up stuff like the high temperatures in the 1930s as proof that global warming and climate change aren’t real. Which is, well… you know.
When it rains, it pours
Parts of Kentucky saw record rainfall this past week. Kind of not the record you want to see broken.
Radar estimates suggest the rain fell at an intensity approaching a “1,000-year” flood, with a 0.1 percent chance of occurring in the region in a given year. But in much of the country, including Kentucky, flood threats have become far more serious than federal flood maps suggest, according to First Street Foundation data analyzed by The Washington Post.
In Graves County, Ky., which includes Mayfield, rain totals that once could be expected to fall once a century on average are now more than twice as likely to occur, according to the data.
Nearly a foot of rain fell in parts of Graves County, prompting the National Weather Service to declare it would likely set a new Kentucky record for precipitation within a 24-hour period — 11.28 inches, based on a preliminary report. The previous record, set March 1, 1997, was 10.48 inches.
Satellite in my eyes
NOAA posted some satellite footage of the severe weather in the northeast and the wildfire smoke moving across the country. Worth a quick watch (although maybe without sound).
AMS word of the week
It’s flare echo!
A weak radar echo in the form of a tapered radial extension beyond the far edge of a severe thunderstorm, associated with the presence of large hydrometeors, especially hail, in the storm.
The core of the issue
This Wired article is kind of hard to summarize but I’ll give it a shot. There was a military base back in the 60s that included tunnels in the Greenland ice sheet. Before it closed, they took a giant ice core. That ice core just kind of chilled until recently.
Nobody cared much about the sediment, though, until 2018, when it was rediscovered in cookie jars in a University of Copenhagen freezer. Now, an international team of researchers has analyzed that sediment, and made a major scientific discovery.
And it’s now giving us some new info.
Previously, scientists reckoned that Greenland iced over some 2.5 million years ago, and has been that way since. In 2021, Bierman and his colleagues determined that it was actually ice-free sometime in the past million years. Now, they’ve dated the tundra ecosystem captured in the Camp Century core to a mere 416,000 years ago—so northwestern Greenland couldn’t have been locked in ice then.
Kinda crazy right?
Office hours with Daniel Swain
Here’s the video from Tuesday and here was the agenda:
Today's focus will be on the extreme to unprecedented heatwaves ongoing on both land and sea throughout the Northern Hemisphere this summer. What's causing it, what's the broader context, and what does it tell us about the future? I'll also discuss California's recent heatwave, which--although notably not record shattering in most instances--will become increasingly notable as it resurges in the coming days.
I took a lot of rough notes which I’ll spare you from. The video is worth a watch if you want a deeper dive on what’s been happening with the heat.
Out of curiosity though, would you be interested in my rough/unedited notes on these offices hours? They’d be easy to publish, they just wouldn’t be very clean.
Time for an update
The ENSO blog posted a June update. It goes into detail on the current state but also talks about what’s ahead. I feel like the article needs to be read in full so I’m not going to pull out a quote for this one.
So that’s why
The SF Chronicle wrote up an article explaining why the hottest day in SF is different from pretty much everywhere else.
Most of Earth’s temperatures closely follow the solar cycle. On average, annual maximum temperatures occur just 3.4 days after the summer solstice. But along the California coast, seasonal temperature extremes are more delayed than anywhere else in the world, according to a 2020 University of Washington research paper.
See you next time weather fam
