Feeling cute, posting about the weather
In which we fly through a hurricane and get schooled.
Just name a few…
Greenhouse gases and you’ll likely come up with things like carbon dioxide and methane. But did you know that water vapour is also considered a greenhouse gas? The Climate Brink recently published a post about water vapour and how it makes extreme weather worse.
As a general rule, molecules with three or more atoms are greenhouse gases, owing to the way the atoms can vibrate and rotate within the molecule. A greenhouse gas in the atmosphere absorbs and re-emits thermal (infrared) radiation and has a blanketing effect, as the emitted radiation is usually at a lower temperature than the Earth’s surface. Accordingly, water vapour (H2O), carbon dioxide (CO2) and methane (CH4) are greenhouse gases. Clouds have a blanketing effect similar to that of greenhouse gases but clouds are also bright reflectors of solar radiation and thus also act to cool the surface by day. In the current climate, for average all-sky conditions, water vapour is estimated to account for 50% of the greenhouse effect, carbon dioxide 19%, ozone 4%, and other gases 3%; while clouds make up a quarter of the greenhouse effect.
Source
Which leads us to the part that water vapour feedback plays:
Climate change is brought on by human activities, most notably burning of fossil fuels putting increasing amounts of carbon dioxide into the atmosphere. However, this is not what has caused the acceleration in disasters. Rather it is the well-known positive feedbacks within the climate system that play off the changes otherwise forced on the climate system and amplify the changes. They depend on the temperature changes and heating already going on. Most notable is water vapour feedback.
As the Earth and its oceans warm up, the water-holding capacity of the atmosphere increases at a rate of about 7% per degree Celsius (or about 4% per degree Fahrenheit). And the record high sea temperatures ensure that there is more moisture in the form of water vapour in the atmosphere as a result. Estimates are 5 to 15% relative to prior to the 1970s, when global temperature increases began in earnest.
But water vapour is a powerful greenhouse gas. The increases have likely increased global heating by an amount comparable to that from increases in carbon dioxide. And we are seeing the consequences!
Can we get a little leeway?
Hurricane Lee is still spinning in the Atlantic and it’s touching all the bases from being a tropical depression to a category 5 hurricane. It’s currently at category 1 and moving northward. There’s a ton of coverage on Lee so I’ll just drop some links. If you’re in New England or Atlantic Canada, you might want to look into it a bit.
- Eye on the Tropics recent update
- WeatherTiger’s Hurricane Watch update
- The Eyewall’s recent update
- Wired article about Lee’s rapid intensification
One thing I really wanted to share though was this footage of hurricane Lee’s eye at category five (slightly longer video here). It’s absolutely amazing.
The Weather Feed is a reader-supported publication. To receive new posts and support my work, consider becoming a free or paid subscriber.
While we’re on the topic
Outside of Lee, there has been some other interesting hurricane related news. Such as:
This year is now the first time on record that there has been at least one Cat 5 observed in every major ocean basin prone to tropical cyclones. In addition to Lee in the Atlantic, we had Cat 5s in the northeast Pacific (Jova), northwest Pacific (Super Typhoon Mawar), North Indian (Cyclone Mocha), the South Indian (Cyclone Freddy and Cyclone Ilsa), and Southwest Pacific (Cyclone Kevin).
Source
Related WaPo article if you want more info.
Gimme the science
Scientists have been studying weather attribution for a while now, and part of that work focuses on attributing human impacts on extreme weather events. A recent WaPo article covered how scientists test whether humans are causing extreme weather. The article has a lot of good info (and I learned about worldweatherattribution.org), but I wanted to share this quote.
Many researchers see extreme event attribution as a communication tool that has the power to connect climate change with people’s everyday experiences. “Doing attribution in real time is what will be the most useful for people to get informed, while there is focus on an extreme event,” said WWA team member Robert Vautard, director of the Institut Pierre-Simon Laplace.
That first sentence is so important, and I think it’s one of the reasons people dismiss so much of the science. It’s like a “well I didn’t experience it so it’s not real” kind of thing. Having that tie to everyday experiences is super important.
I wish I could do that
I admit fam, I cannot draw, paint, sketch, or even color inside the lines very well. Rosemary Mosco sure can though. Among other things, she publishes something called the Climate Comic.
Just a cool tool
And there’s no download required! https://earth.nullschool.net/ is a free webapp you can use to look at current and future conditions across the globe. The interface is pretty simple (select the little menu in the lower left and then click around).
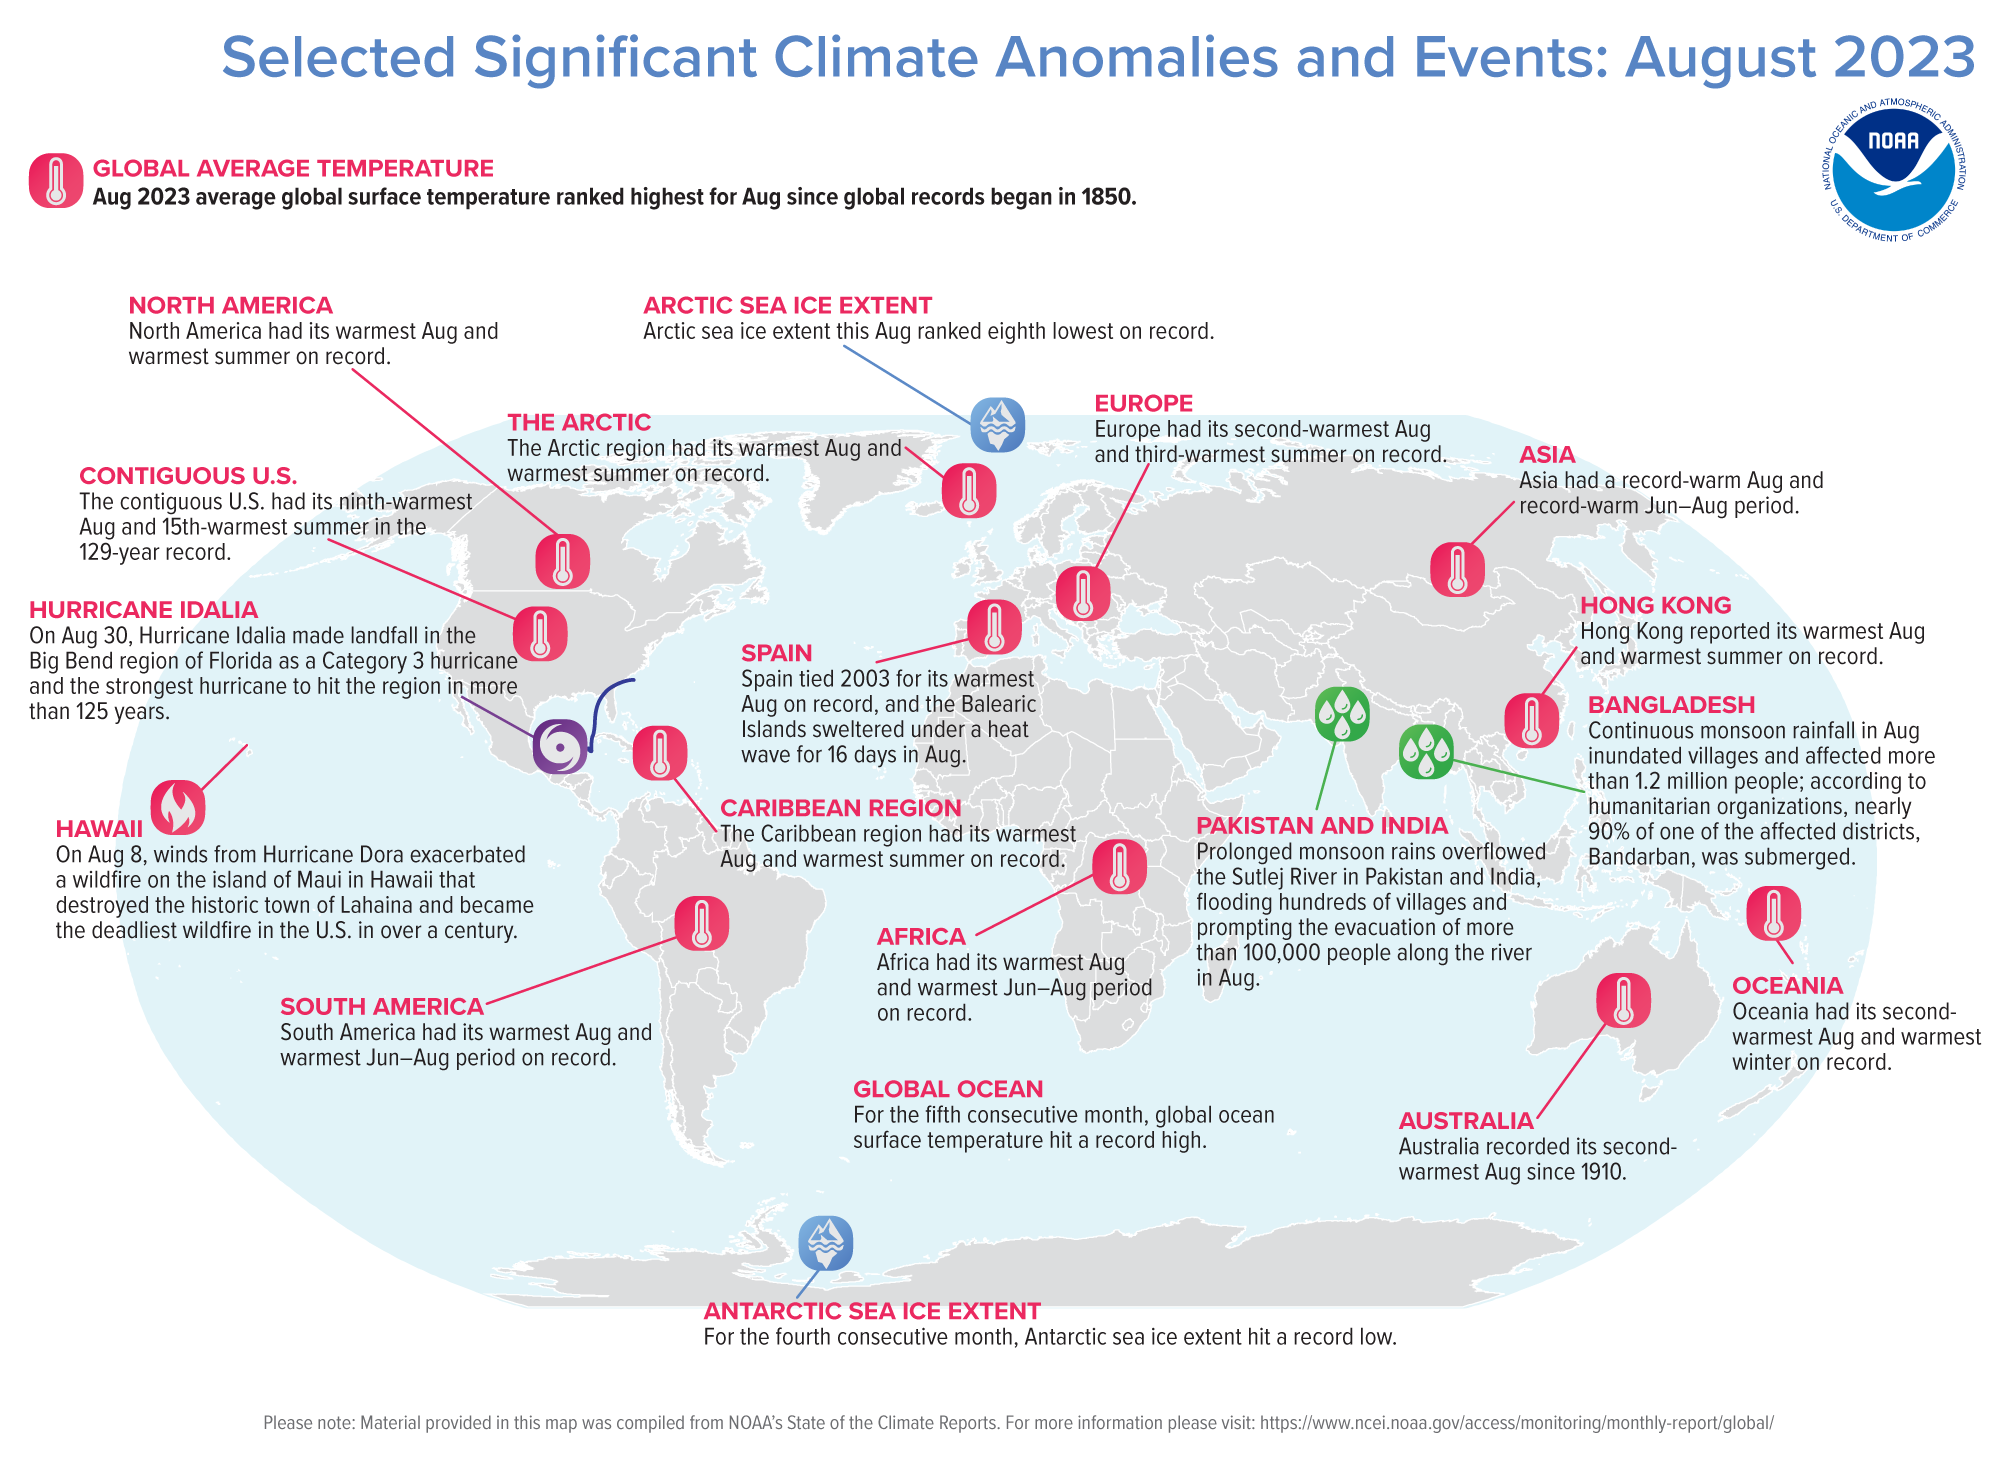
August reports are in
Here’s the U.S. Climate Report and the Global Climate Report. As usual, each report lists out some key points and then jumps into the details. On the Global side, here’s the selected anomalies and events map.
A cute convo
The ENSO blog’s recent post is in the form of a Q&A with the Pacific Ocean and the tropical atmosphere. It’s a pretty fun update. Here’s a bit of a spoiler for the rest of the year:
The global climate models we rely on are pretty certain that the currently observed warmer-than-average sea surface temperatures will last and even strengthen through winter 2023–24. After which, this El Niño event is expected to weaken, which is normal for these types of events.
The continued model confidence is one reason why forecasters have odds of over 70% that the current event will peak as a “strong” El Niño (Niño-3.4 index values greater than 1.5˚C) for the November-January average. There is even a 30% chance that Niño-3.4 values exceed 2.0˚C by this winter, which would put ocean temperatures in a tier with some of the strongest El Niños since 1950.
But to our readers, a few reminders from the ENSO Blog archive.You cannot blame EVERYTHING on El Niño.No two El Niños are alike, and the same goes for their impacts. And, Just because a strong event is forecasted does not necessarily mean strong impacts. Instead, El Niño can increase the chances for certain types of extremes.
The usual suspects
Here are your 6-10 outlooks:
And an obligatory satellite loop
Just because it’s fun (source for the gif, not the fun).
Daniel Swain office hours
The last session was on the 12th and it was in an ask-me-anything (AMA) format. My brief (and rough) highlights:
In regard to the “easterness” of the developing El Niño
What does east mean here? The California coast isn’t the eastern-most part of the Pacific.
Ocean temps are most above average off the west coast of South America, rather than south of Hawai’i or central Pacific.
That effects the longitude of where tropical thunderstorms develop, this matters where the jet stream gets perturbed and where Rossby wave trains emanate from in the upper atmosphere.
East-based events tend to have greater impact on CA (this might have been somewhat specific to SoCal) and tend to set up favorable jet stream configurations for bringing storms to CA.
Long term step increases in temperature from this El Niño?
For 1-2 years yes, then it will slow down, and then it will speed up again.
Many times people report that slow down in temperature after an El Niño event, but climate change is also boosting temps, so even when El Niño fades away, the portion that warms due to greenhouse gases is still there.
Farewell for now, comrades
See you next time weather fam! I’ll leave you with some photos from last week.