Call me on my supercell
In which we learn about PWATs and talk about weather comms.
Did you get my message?
If you’ve been reading for a while, you know we talk about weather communications sometimes. What gets communicated, when, and how are all important factors.
If you’re in the U.S., you likely received a test alert last week on your phone. A recent WaPo article sort of chronicles these alerts, including their successes and failures. The issue of over-alerting people was brought up again as well. From my point of view, there are certainly improvements that need to be made but it’ll be worth the effort. Saving lives is like, ya know, a good thing.
So you wanna know more about…
Climate change and prescribed fires right? Well, you’re in luck. Daniel Swain, along with other scientists, recently published their research on this topic. You can read a blog post about it or watch this YouTube video.
The research is a bit difficult to summarize so I encourage you to read the blog post. Some of the results are maybe not surprising, but with a topic as complex as this, there were a few nuances and (for me) unexpected results as well.
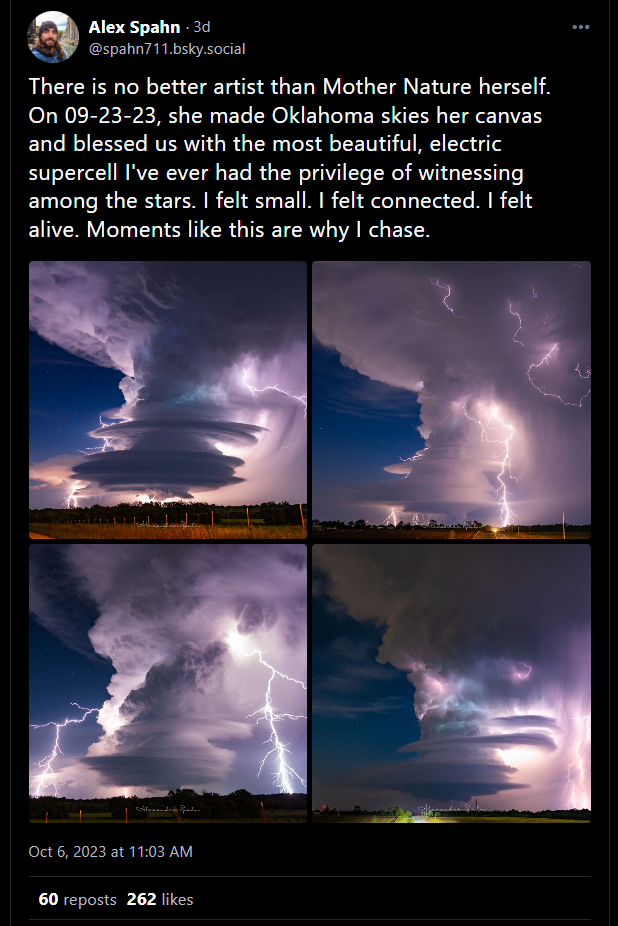
That’s a super supercell
Check this thing out, like wow.
The Weather Feed is a reader-supported publication. To receive new posts and support my work, consider becoming a free or paid subscriber.
Nice, higher resolution
There’s a new dataset out that provides some higher res info for the continental United States. This is cool because:
Despite the importance of reanalysis products, they are generally low resolution with about 30 kilometers (19 miles) or more between grid points—a spacing too coarse to capture relatively fine-scale weather events, like summer thunderstorms, and the local topography that impacts those events, like mountain ranges. They're also too coarse to give meaningful data about precipitation in individual watersheds, which is critical information for water managers. It's this last point that has been a particular frustration for the USGS, which is responsible for collecting and distributing information to the nation about water resources, including streamflow and groundwater data.
To address this gap, the USGS partnered with NCAR to "downscale" one of the most widely used global reanalysis datasets, called ERA5, to create a high-resolution dataset for the contiguous United States (CONUS) using NCAR's Weather Research and Forecasting model (WRF).
The resulting dataset covers more than 40 years (1980–2021) at 4-kilometer grid spacing—hence the name, CONUS404.
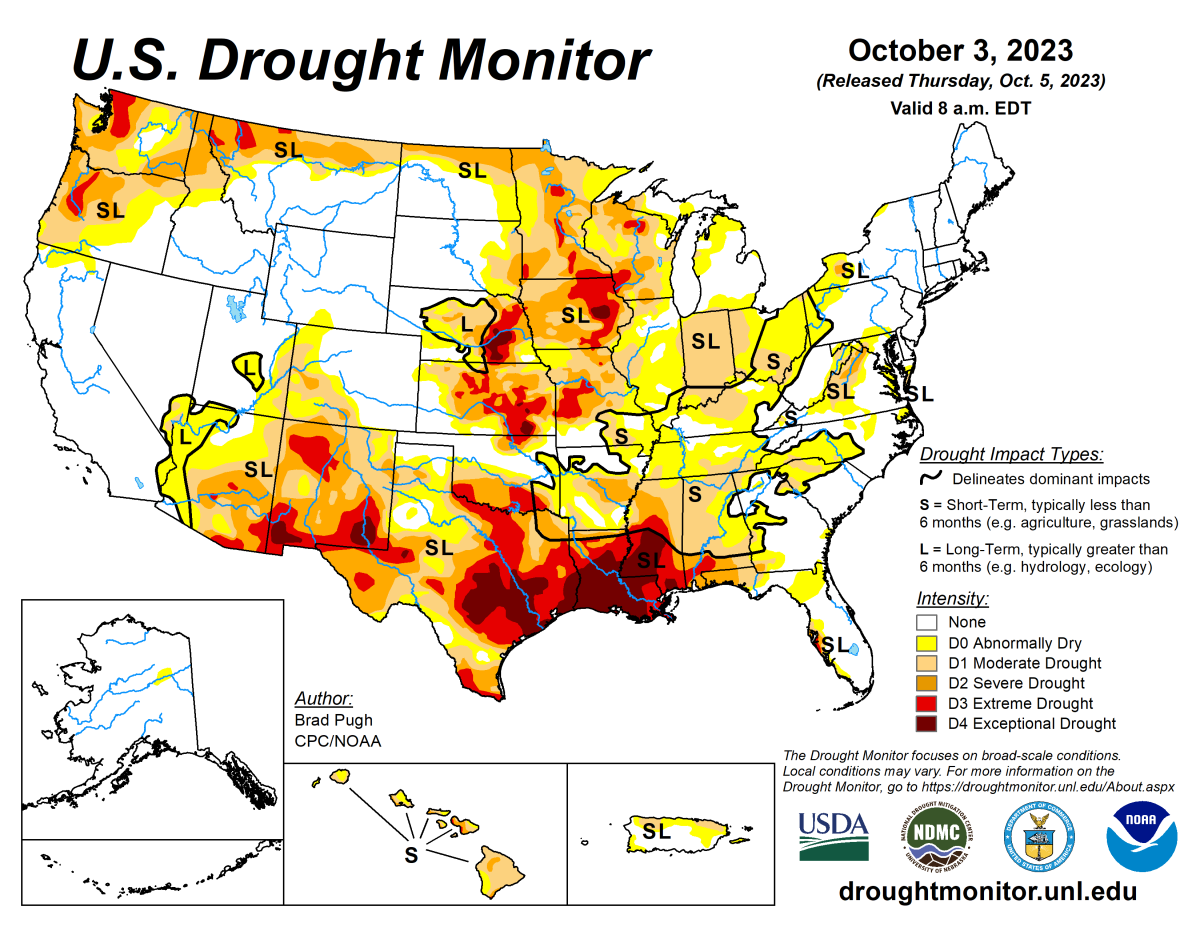
Been a while…
Since I posted any drought info. It has honestly slipped my mind with the mild summer we’ve had. The drought monitor is posted weekly though so here’s the latest. I might add this to the “usuals” section as well.
From the NWS glossary
PWAT
Precipitable Water - measure of the depth of liquid water at the surface that would result after precipitating all of the water vapor in a vertical column over a given location, usually extending from the surface to 300 mb.
Source: https://w1.weather.gov/glossary/index.php?letter=p
Some satellite imagery
You can see the system bringing some light rain to our neighborhood out west, but look at that cyclone over eastern Canada!
The usual
Here are your 6-10 day temp. and precip. outlooks.
And your convective outlooks too.
That’s it for now
See you next time weather fam, thanks for reading 💙!
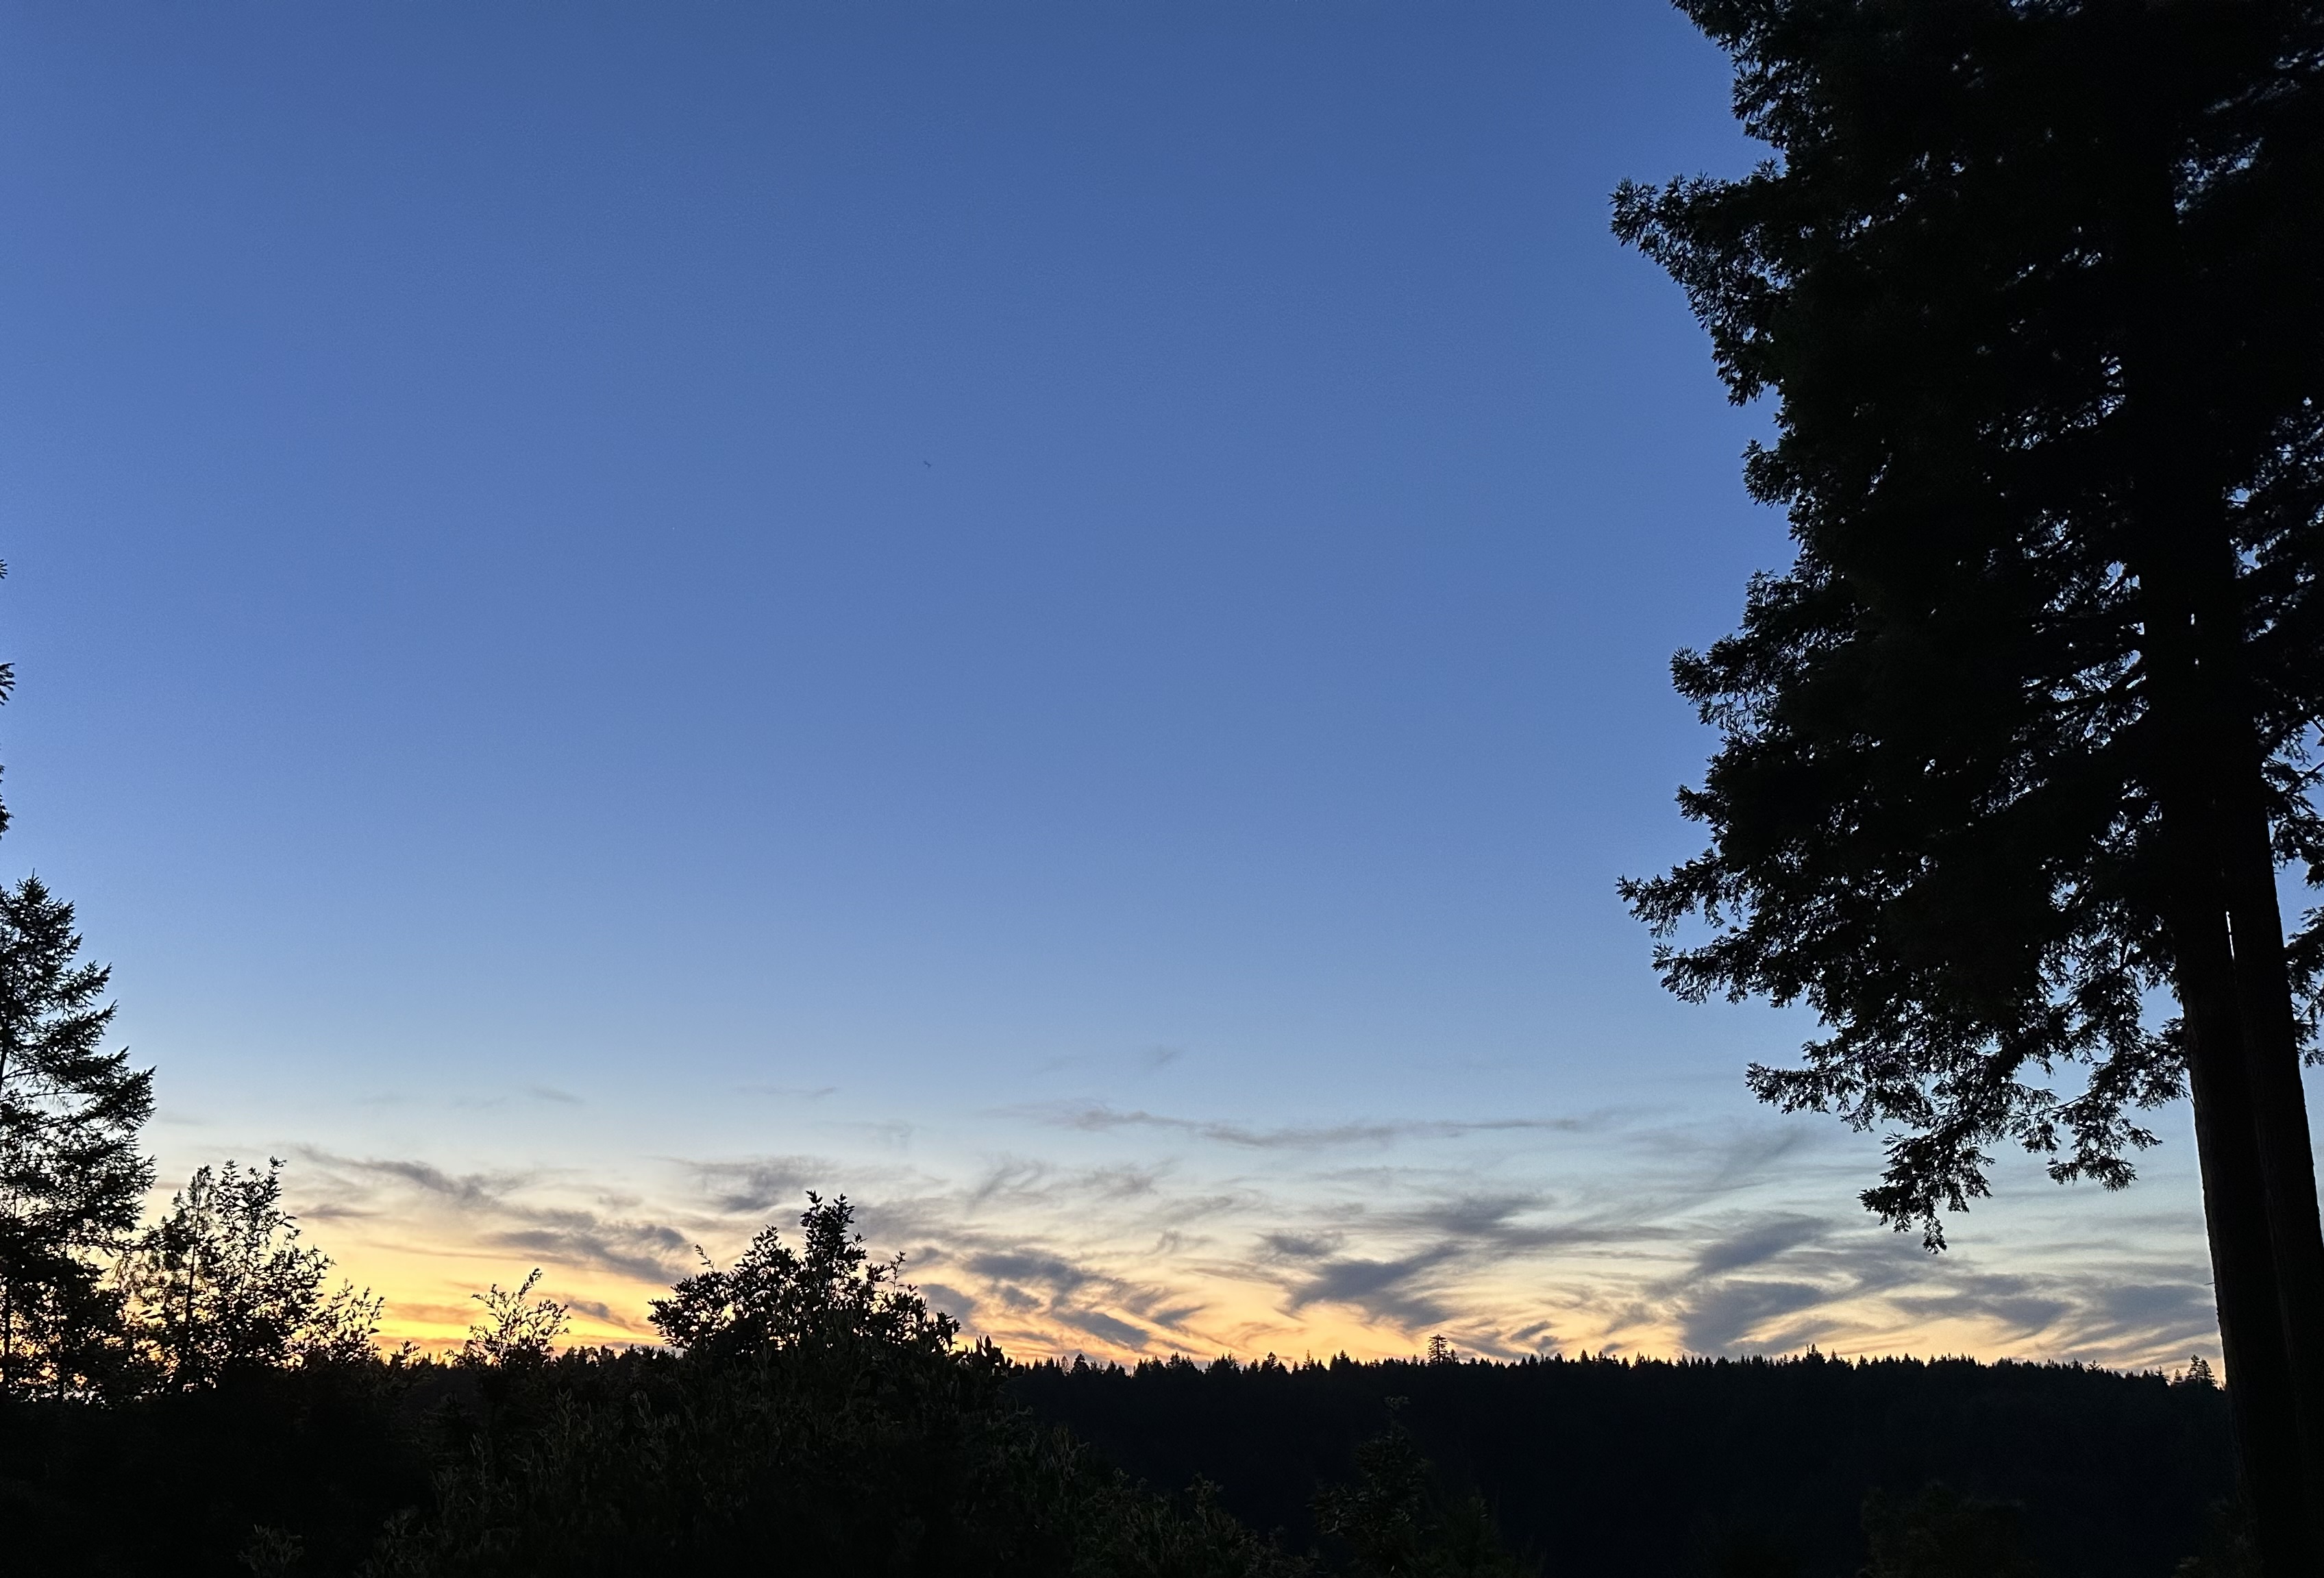
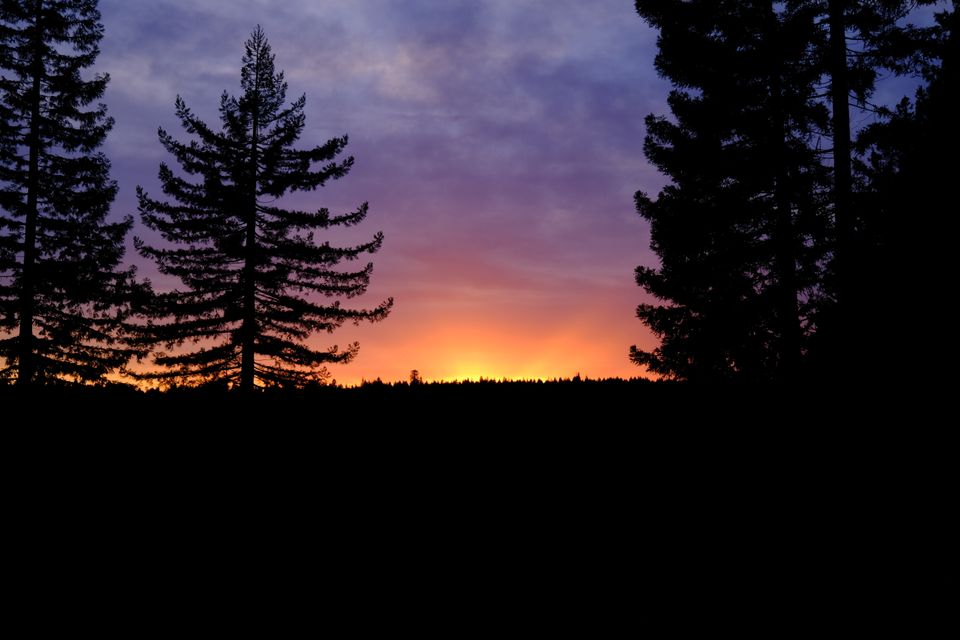
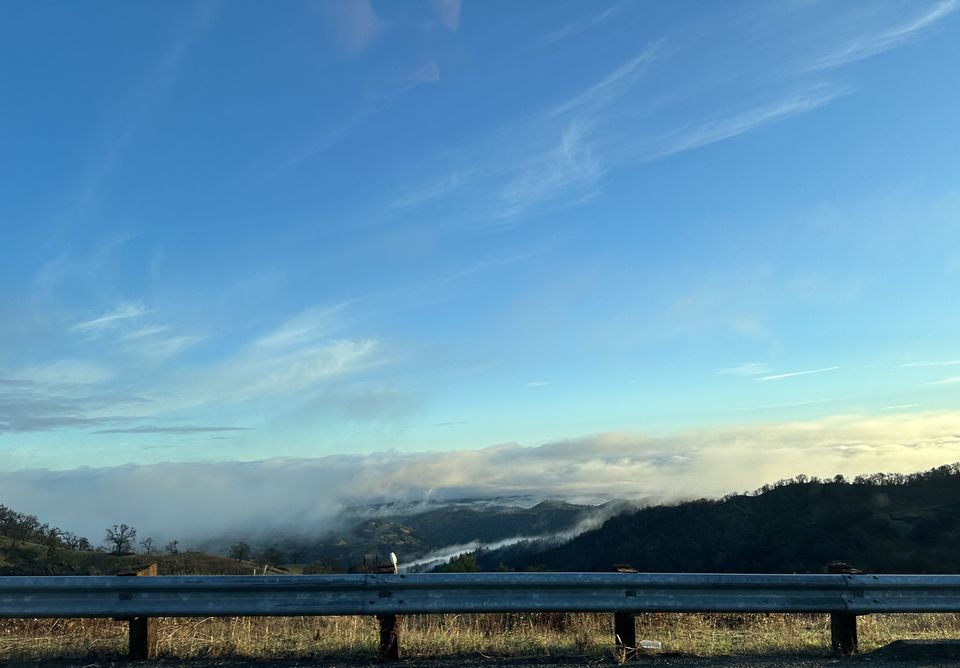
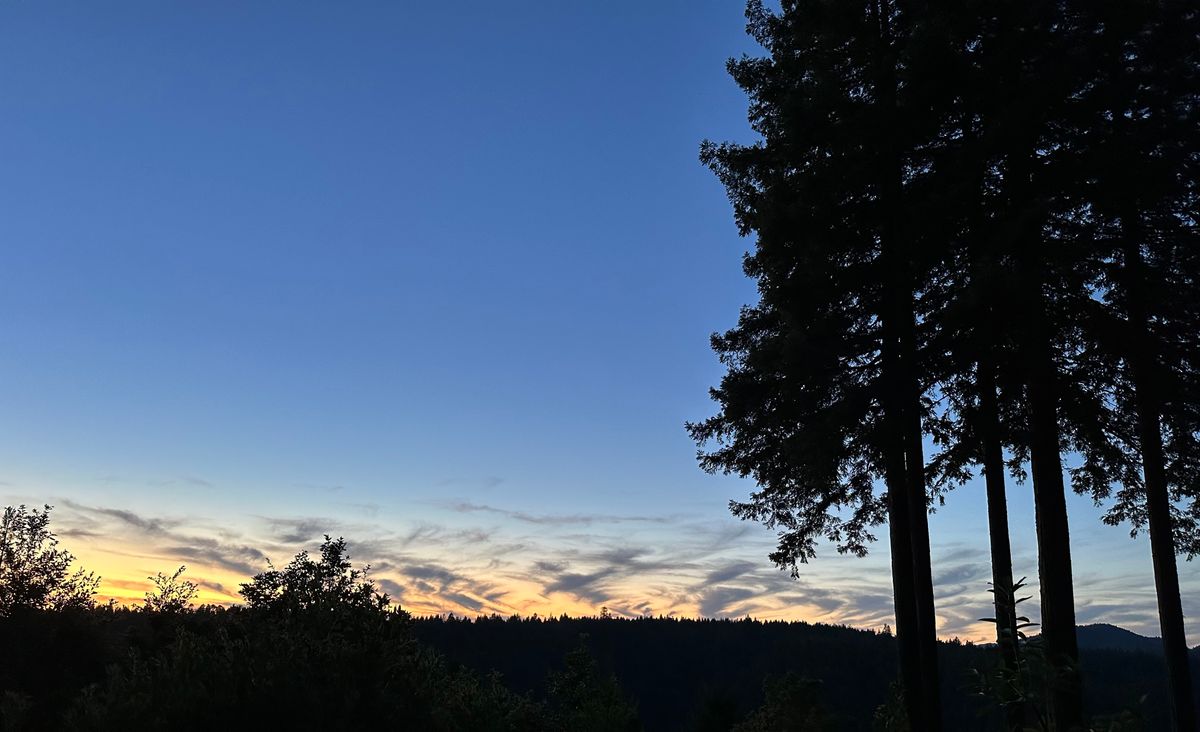
I’ll leave you with a few photos from last night, before the rain clouds showed up.